Last week I wanted to post a blog-post-a-day about SEO but this one is a doozy so it carried over to this week. In today’s post about SEO I will explain Google Analytics a little. If you are not familiar with Google Analytics, it is the standard when it comes to tracking website traffic. Even if your web provider has some mechanism by which they show you stats for your site, it is secondary to Google Analytics and you should absolutely have it installed on your site. I would go as far as to say, if you do not have Google Analytics installed then why do you have a site? I think that if you don’t have it installed then you are not serious about understanding how people are using your website. Too strong? Perhaps. Let’s read on and hopefully the strength of my position will rub off on you when you find out how awesome it is.
Ok, so if you are not familiar with Google Analytics then let’s start with it being FREE. Yup, that is right. This wonderful little tool is just given away by Google. If you have an Google Account just go to the Google Analytics home page you can sign up for free. Google even provides you with amazing instructions for how to get started.
Now that you have Google Analytics installed let’s take a look at the reports that I feel are the most important.
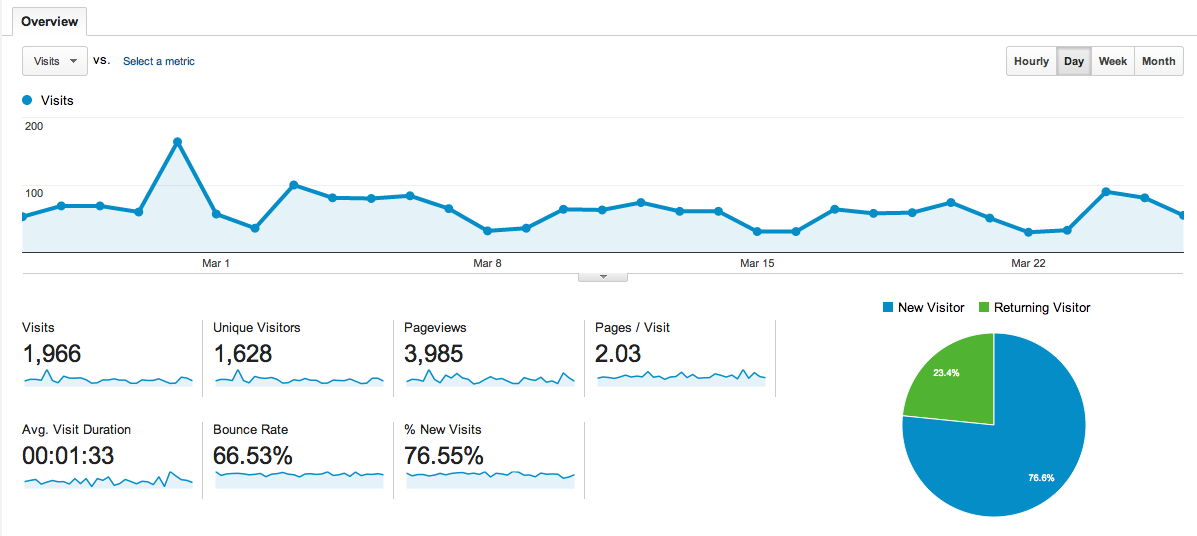
When you first log into the reports Google Analytics shows you a graph of the Visits over the last 30 days. Typically, I start by looking for spikes in traffic. That would indicate that either something we wrote was extremely popular or that the site got posted somewhere that is sending us a lot of traffic. Either way I want to know who, when, how the spike was created. If you hover over the points on the graph it will tell you the numerical value of the point.
This initial page also shows how many Visits, Unique Visitors, Pageviews, Pages per Visit and Average Visit Duration. All of these are important to know. Depending on the type of site you have (commerce vs blog vs brochure site) I would weight them differently. Visits and Unique Visitors are just barometers for how much traffic you are getting. Generally speaking the more the better. But I also want to caution you that a ton of traffic without conversion means you are missing something. I’ll gladly take a lower numerical value of visitors for a higher percentage of conversions. Pageviews and Pages Per Visit tell me that once the person is on the site they are poking around a bit. The Duration of their visit tells me whether it was just a cursory glance of the site or if they are reading through something on the site. Several months ago I wrote a blog post that was the longest I’ve ever written and the Duration for that site averages around 9 minutes which is just crazy!
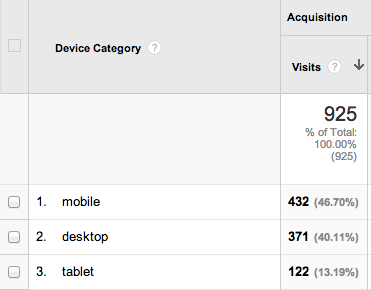
If you look at the side navigation you should see Mobile and then below it find Overview. I like this report as it gives me information about the types of devices that are using the site. I can immediately tell whether I have a mostly Mobile or Desktop audience. As you can see in the image below the audience for this particular site is mostly Mobile. If I have an audience that is mostly Mobile and my website is not responsively coded or have a mobile version then I am handicapping my site.
Next we are going to look at Acquisition / All Traffic report. I like this report as it will tell you where your traffic is coming from. Remember those spikes I mentioned? Those should manifest themselves here as a site that has sent you a large amount of traffic. If you want more detail as to the URL that is sending the traffic then go to Acquisition / All Referrals and click on the website sending you the traffic. It should give you a breakdown of the URLs that are originating the traffic.
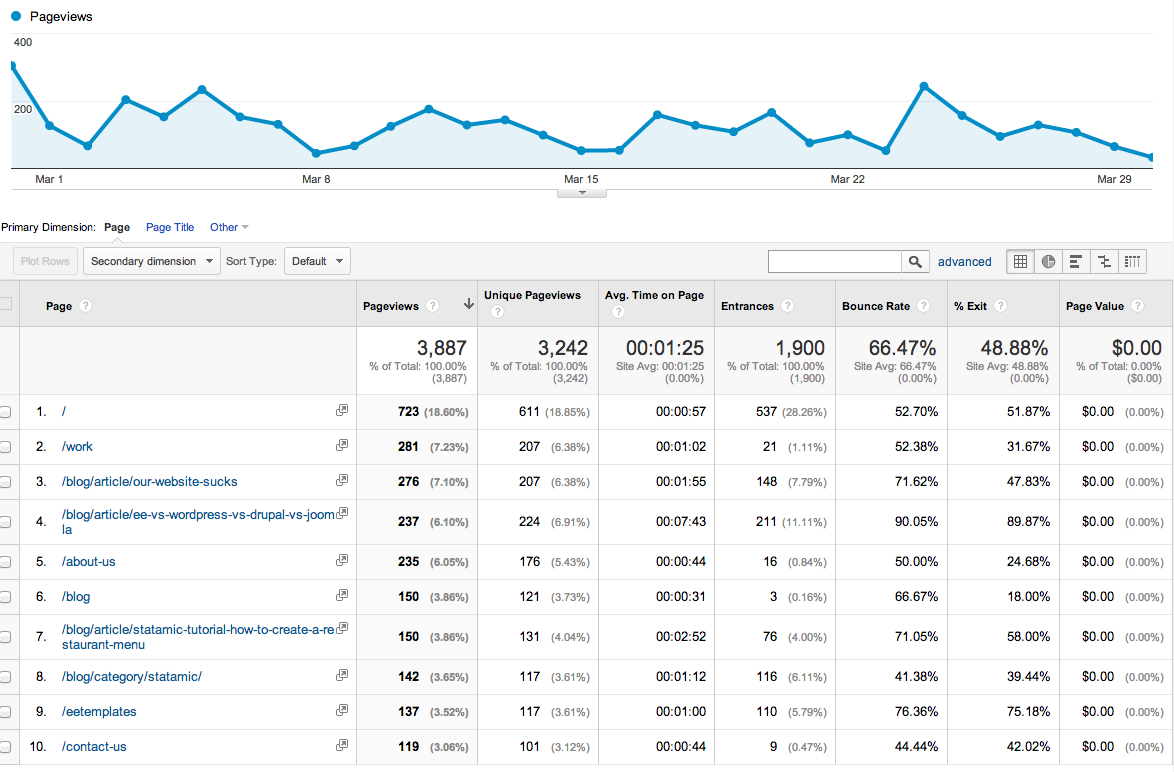
The last thing (and quite possibly the most important) that I look for is under Behavior / Site Content / All Content. This report tells you what people are looking at on your site. It is important to note that / means the home page. So more than likely / will always be at the top of the list. I like to check this report weekly. Especially if we are blogging a lot. It tells me what topics are hitting the mark with folks that read our blog. If a certain topic is getting more interest than others then I will spend more time writing content on that topic.
I hope that the recent posts on SEO have been helpful. As always, we are here to help if you need it. I’d like to offer you a free (short) analysis of your Google Analytics traffic. Just send us an email to get started.