Today I was visiting with a client that runs a local restaurant. I wanted to show some metrics of how the redesign that we did of their site was performing. What I found when I started looking into the numbers was a surprise even to me. Keeping in mind they are not Facebook getting millions of visitors a day. As we look at the numbers focus on the improvement not the quantity.
Here is what the Analytics show:
Sept 15 to Oct 15
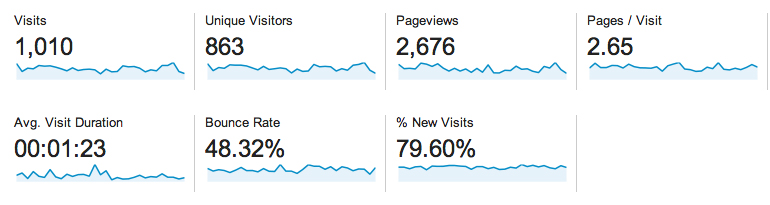
From Sept 15 to Oct 15 there were 1010 Visits, 863 Unique Visitors and 2676 Pageviews
Oct 16 to Nov 15
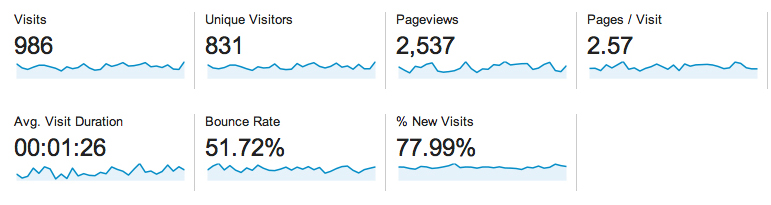
From Oct 16 to Nov 15 there were 986 Visits, 831 Unique Visitors and 2537 Pageviews
Nov 16 to Dec 15
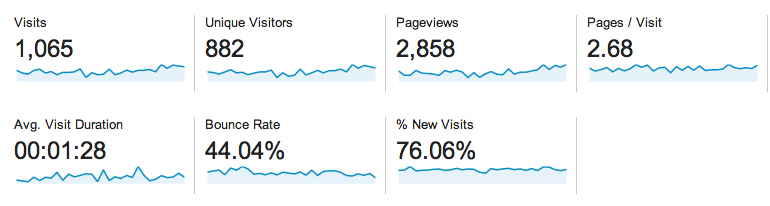
From Nov 16 to Dec 15 there were 1065 Visits, 882 Unique Visitors and 2858 Pageviews
Dec 16 to Jan 14
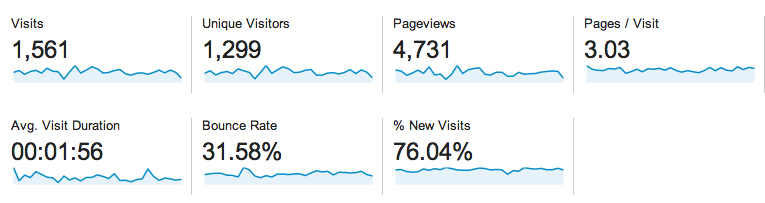
From Dec 16 to Jan 15 there were 1561 Visits, 1299 Unique Visitors and 4731 Pageviews which is really odd because you would expect traffic over the holidays to slow down. I can't wait to see what the analytics say about next month's traffic.
If you've never seen Google Analytics (GA) the above may be foreign to you. GA shows these basic metrics when you view your analytics for your site. The ones I typically track are Visits, Unique Visits, and Pageviews. In some instances Time on Site makes sense to look at if you are writing a lot of content and trying to gauge whether folks are reading it or not.
So if we look at those metrics (Visits, Unique Visits, and Pageviews) as an average from Sept 15 to Dec 15 you see the following:
- Visits - 1020
- Unique Visits - 858
- Pageviews - 2690
Compare that to the numbers post launch:
- Visits - 1561
- Unique Visits - 1299
- Pageviews - 4731
That is an increase of:
- Visits - 53%
- Unique Visits - 51%
- Pageviews - 76%
Not too shabby for a single month increase. But why? Without spending hours diving into the reports that GS provides I think I have narrowed it down. When I looked at the mobile traffic for the previous three months it averaged out to 468 visitors on mobile. When I looked at the last 30 days it was 839. That is an increase in mobile traffic of 79%. The other devices were up as well but not nearly as much as mobile.
So it does not take a leap of faith to draw the conclusion that a responsive site worked in this case. Making it easier to navigate on the smaller screens meant people visited more often, looked at more pages (pages per visit went from 2.62 to 3.03) and spent more time on the site. Making the site Responsive really works for a restaurant since folks are often away from their computer when they are researching where to eat.
If you have any questions about your own Google Analytics numbers, or want to talk about how to interpret them, just contact us